Validation: what held up, and what did not
Last updated: 21 October 2026 · re-run 27 October 2026: the Hormuz series was rebuilt from the raw GDELT archive and reproduces the same result (p = 0.33553, lag 4)
We test the signal before we sell it, we fix the hypothesis before we look at the result, and we report every test we ran — including the ones that failed. This page is the short version. The method behind it is on Method and provenance.
The one-line version. In the pre-registered confirmatory family (three hypotheses), two survive multiple-testing correction: Suez 2021 and Ukraine 2022. The third — the Strait of Hormuz against Brent — is null. We publish it as null and we do not sell a Hormuz price lead.
1. The confirmatory family (m = 3)
Three hypotheses were written down before testing, one per case, and each is a single pre-specified direction (stress → price). Because three hypotheses were tested, we correct for multiple comparisons with FDR (Benjamini–Hochberg). The family size is three, not thirty-three — that distinction is the whole point, and it is explained in section 3.
| Case | Pre-registered test | Lag | Raw p | FDR q | Result |
|---|---|---|---|---|---|
| Suez Canal · 2021 | stress → Brent | 1 week | 0.00598 | 0.01794 | holds |
| Ukraine · 2022 | stress → DE-LU power price | 2 weeks | 0.02048 | 0.03072 | holds |
| Strait of Hormuz · 2024–25 | stress → Brent | 4 weeks | 0.33553 | 0.33553 | null |
Granger-style predictability tests on weekly aggregates; Brent from FRED
(DCOILBRENTEU, public domain), EU day-ahead power from the respective market operators.
"Lag" is in weeks, not days.
2. The Hormuz null, in full
This is the case a buyer usually asks about first, so it deserves the numbers rather than a summary sentence. Hormuz is a chronic-friction chokepoint: the series is flat most of the time, and flat series carry very little statistical power. That is an explanation, not an excuse — the result is still null.
Hormuz stress → Brent, 2024–25.
| Test | Result | Reading |
|---|---|---|
| Best lead correlation (k = 3 days) | r = 0.0264 · permutation p = 0.9502 | indistinguishable from noise |
| AR(1) control series | r = 0.0443 · permutation p = 0.862 | the control fails too — there is no lead to detect |
| Granger, weekly, lag 4 | p = 0.33553 | not significant |
| Iran-only stress → Brent | p = 0.73958 (lag 1) | not significant in any lag tested |
An honest permutation test should put a real signal near p = 0.0, and a meaningless one near 0.95. This one lands at 0.9502. The AR(1) control landing at 0.862 as well tells you the null is not a power problem in the series — there is simply no relationship to find in this window.
What this means commercially: if a vendor sells you a Strait of Hormuz oil-price lead, ask which test it came from and how the family was sized. We could not reproduce ours, so we do not sell it. We still monitor Hormuz as a current-state risk object — a number describing how stressed the reporting is today — but not as a prediction of the oil price.
3. Physical and geographic validation
Where a claim can be checked from orbit, we show the image instead of asserting it. Below is the Strait of Hormuz as NASA's satellites saw it — the corridor the current signal is about. The same frame is in the public archive, so anyone can check it independently.
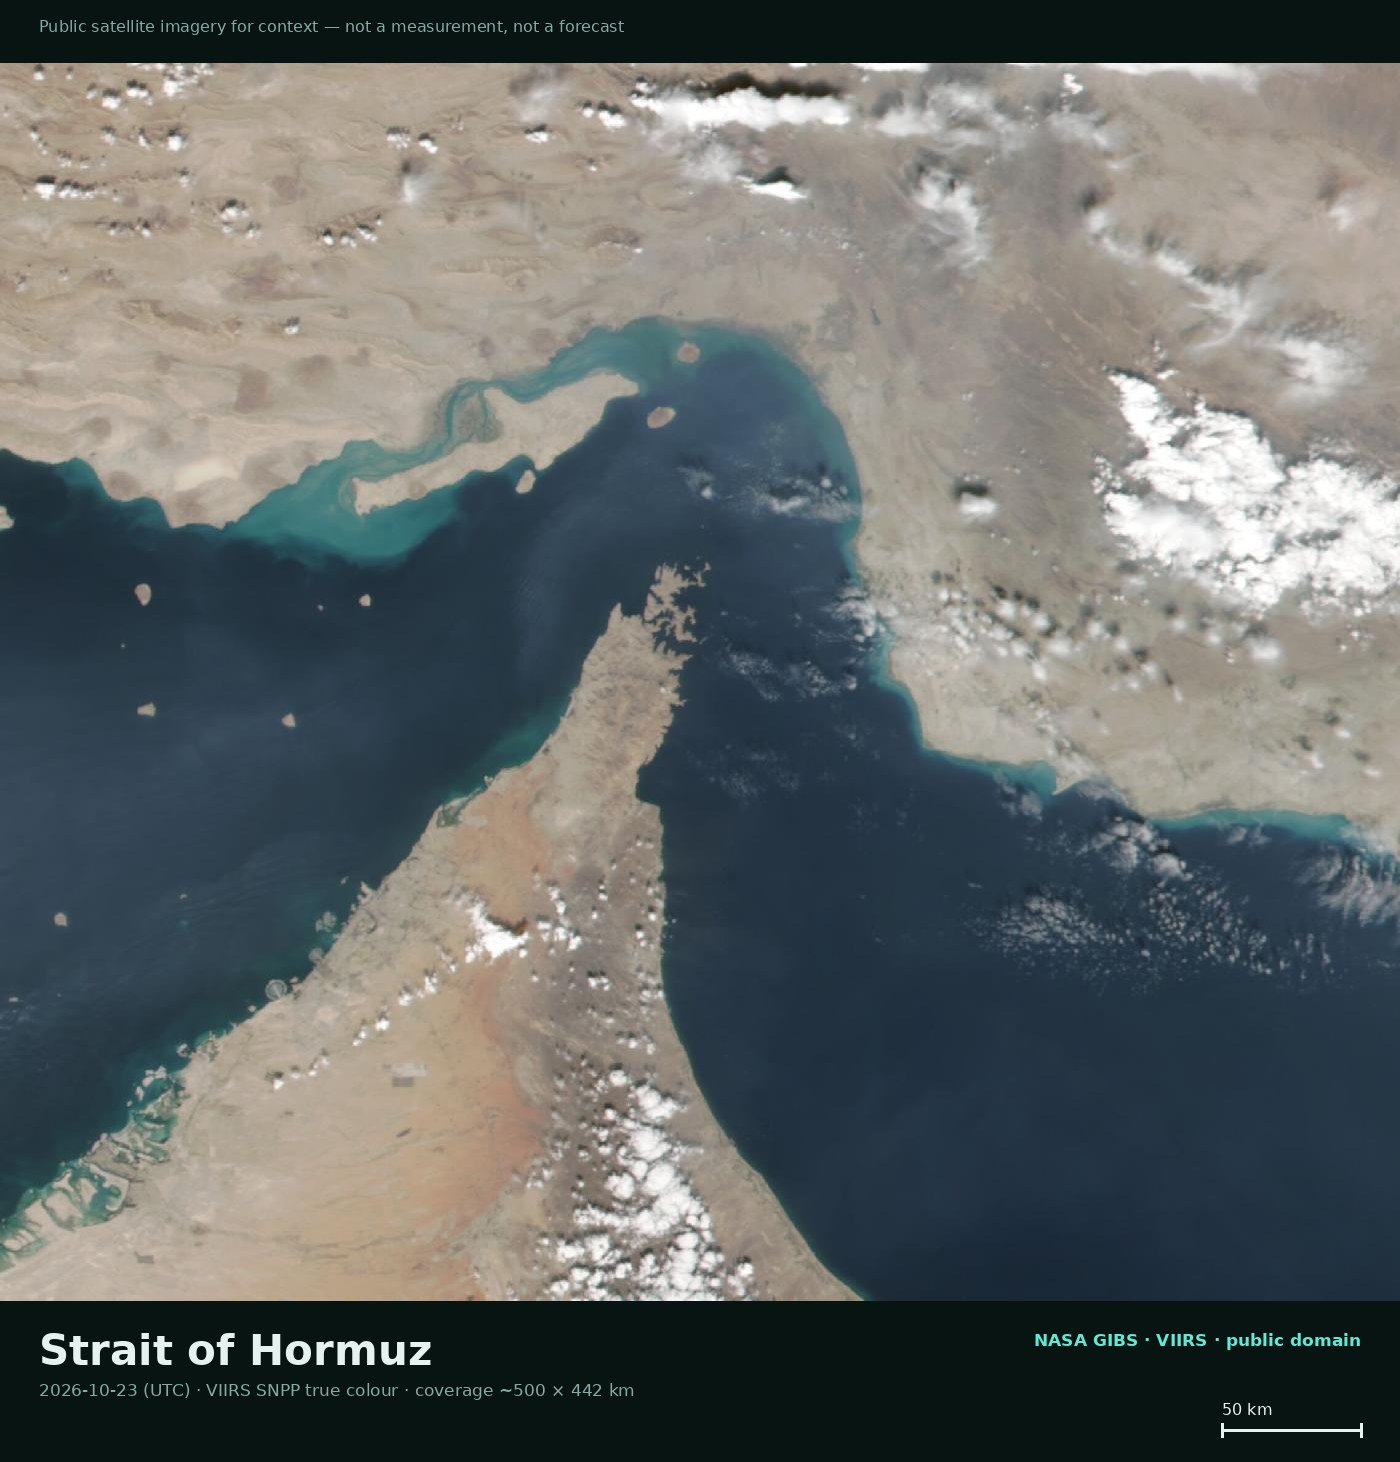
What we deliberately do not do with it. No vessels are marked, no facilities are identified, no damage is assessed, and no coordinates are published. The frame is wide on purpose: it is a context view, not a targeting product. That is a scope rule written down in our methodology, not a disclaimer bolted onto an image.
4. The exploratory family (m = 33), and why it is not evidence
We also ran 33 cross-pair tests to find out which pairs were worth a pre-registered look. That is hypothesis generation, and it is reported separately for a reason:
| Family | Tests | Raw p < 0.05 | FDR q < 0.05 |
|---|---|---|---|
| Confirmatory (pre-registered, m = 3) | 3 | 2 | 2 |
| Exploratory (hypothesis generation, m = 33) | 33 | 7 | 0 |
The difference between those two rows is only family size. The same data produces 7 raw hits out of 33 tests — close to what pure chance with 33 draws would give you under a 5% threshold — and none of them survive correction. Presenting any of those seven as a finding would be exactly the mistake this page exists to avoid.
A worked example of that mistake. One exploratory pair, Brent → Ukraine
stress, reaches raw p = 0.00817. Its corrected value is q = 0.10230 — it does not
survive. The Ukraine hypothesis that does survive is the other direction, stress → DE-LU power
price, at q = 0.03072. The two are easy to conflate, and an earlier version of our own
homepage did exactly that. It is corrected now.
5. What we do and do not claim
- Do: a current-state stress score, sourced and normalised, on a documented method, with the tests above and their null results published.
- Do not: a price forecast, a trading signal, or a price lead. Granger-style predictability is a statistical lead in a particular window, not causality, and it is not a forecast.
- Do not: claim these tests generalise beyond their windows. Suez 2021 is one event of a few weeks; it is evidence that the construction can carry information, not proof that it always will.
6. Known biases — measured, not hidden
No open-source index is neutral. These are the biases we know about, with a dated measurement and the guardrail we apply. Where there is no guardrail yet, we say so.
Measured on 21 October 2026: 4,117 relevant articles from 140 feeds in nine languages.
| Bias | What it does | What we do |
|---|---|---|
| Feed concentration | A single prolific feed can move the aggregate. | Measured daily. Today the largest feed is 23.7% of the corpus (target ≤15%) and HHI is 0.081 (target ≤0.05). Both are above target and we publish that; the leave-one-feed-out rank correlation is part of the same quality report. |
| Language coverage | English-language reporting lags regional sources; a thin language can skew a country. | Nine languages are collected. Today: Arabic 50%, Russian 19%, English 15%, Chinese 5%, Hebrew 4%, Hungarian 4%, Persian 2%, Turkish 1%, German 0.5%. Coverage is denser for MENA and Eurasia than for Africa or Asia; each response exposes the source-script mix. |
| Media attention | Loud stories inflate volume, not intensity. | Intensity (stress) and volume are separate numbers — a high volume of low-intensity reporting does not read as a crisis. |
| Repeated reporting | The same story counted many times. | URL-level deduplication inside the collector (8 duplicates skipped today) and cross-source clustering for the brief. The aggregate is not deduplicated across feeds — that is the cross-source signal — so a wire story carried by many feeds does add volume. |
| State-aligned and designated sources | Propaganda feeds can dominate a basket. | Article-level sanctions matching and a designated-source flag in the brief (0 such flags in today's brief). The aggregate is not down-weighted yet — a known gap. |
| Calendar effects | Weekends and holidays produce less reporting. | Not normalised. The series is published as-is; a quiet Sunday is not a quiet world. |
The figures above are a dated snapshot; the full quality report is regenerated with the corpus.
7. Reproducing this
Each paid response is timestamped and carries the version of the scoring rules it was produced with, so a number you receive can be checked against the rules and the data window behind it (see Integrity). The backtest artefacts behind the table above are kept as JSON next to the pipeline, and the method page documents the scoring stages. If a reviewer wants the raw series for a specific case, ask and we will provide it under the same terms as the product.